|
Size: 1830
Comment:
|
Size: 1830
Comment:
|
| Deletions are marked like this. | Additions are marked like this. |
| Line 6: | Line 6: |
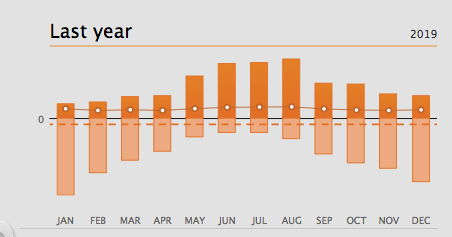
| * The 2009 graph shows net generation of 3750kWh, compared to 2436kWh in 2018. Above the axis is consumption, below the axis is generation, the broken line is the average net per month. | * The 2019 graph shows net generation of 3750kWh, compared to 2436kWh in 2018. Above the axis is consumption, below the axis is generation, the broken line is the average net per month. |
Link to SolarPowerProposal > PropertySolarPanels
Performance of our solar panels in 2019
- The 2019 graph shows net generation of 3750kWh, compared to 2436kWh in 2018. Above the axis is consumption, below the axis is generation, the broken line is the average net per month.
PropertyCommittee are progressively replacing lights with more efficient LEDs
- The office was done last year and men’s and ladies toilets done so far this year, with store rooms underway. Next is the foyer.
- Plans are underway to get the manses converted to solar. We may not save money, but it will be a big plus for our overall footprint.

Performance of our solar panels 2017-2018
Electrical
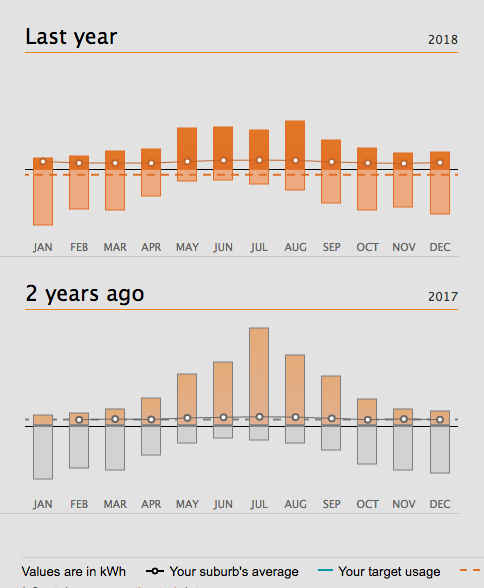
- The picture shows usage and generation by month for 2017 and 2018.
- It can be seen that we became a net generator for 2018. (Net consumption, the broken line, is positive for 2017 but negative for 2018.)
- The big difference between the two years was the installation of the new heating system in the worship centre, visible as reduced winter consumption.
- The price difference between buying and selling means that we still pay something for electricity, but much less than we would without the panels.

Financial
Loan Summary Totals to end 2018
Original loan was approx $48,000.
Solar and LED Lights Loan Balance now becomes:-
Carried Forward from August - Solar Loan balance |
$12,647 (refer email dated 17th August 2018) |
Less November 2018 Savings (as above) |
$1,532 |
New Solar loan outstanding balance |
$11,115 |
Plus LED Worship lights additional loan added |
$16,838 (Church Council added) |
New Total Def/Main Outstanding loan - incl new lights |
$27,953 |
 The Glen Waverley Uniting Church PSALTER