|
Size: 1030
Comment: Added comment
|
← Revision 5 as of 2020-08-04 03:27:42 ⇥
Size: 1096
Comment:
|
| Deletions are marked like this. | Additions are marked like this. |
| Line 12: | Line 12: |
| * More recently, Victoria seems to have stopped reporting around July 20. | * More recently, Victoria seems to have stopped reporting around July 20, as is evident in the picture below, but more obvious at the site. |
Link to https://nextstrain.org/ncov/oceania?dmin=2020-06-14&l=radial
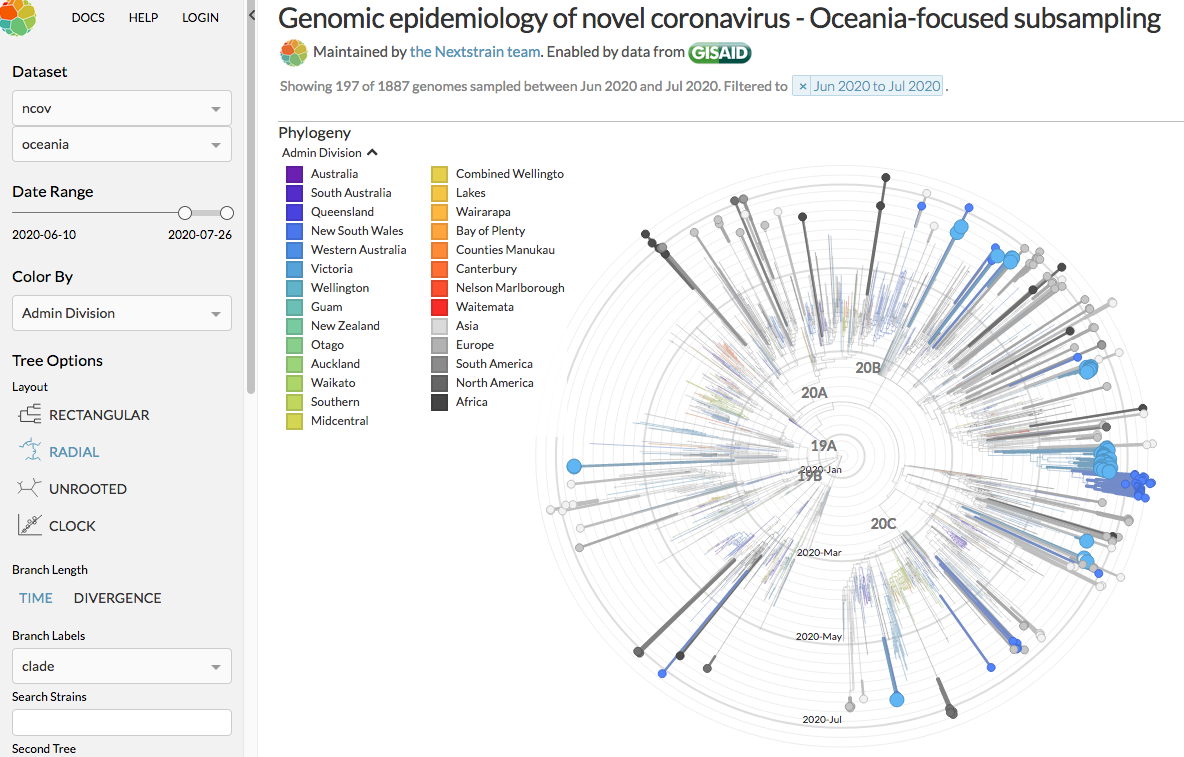
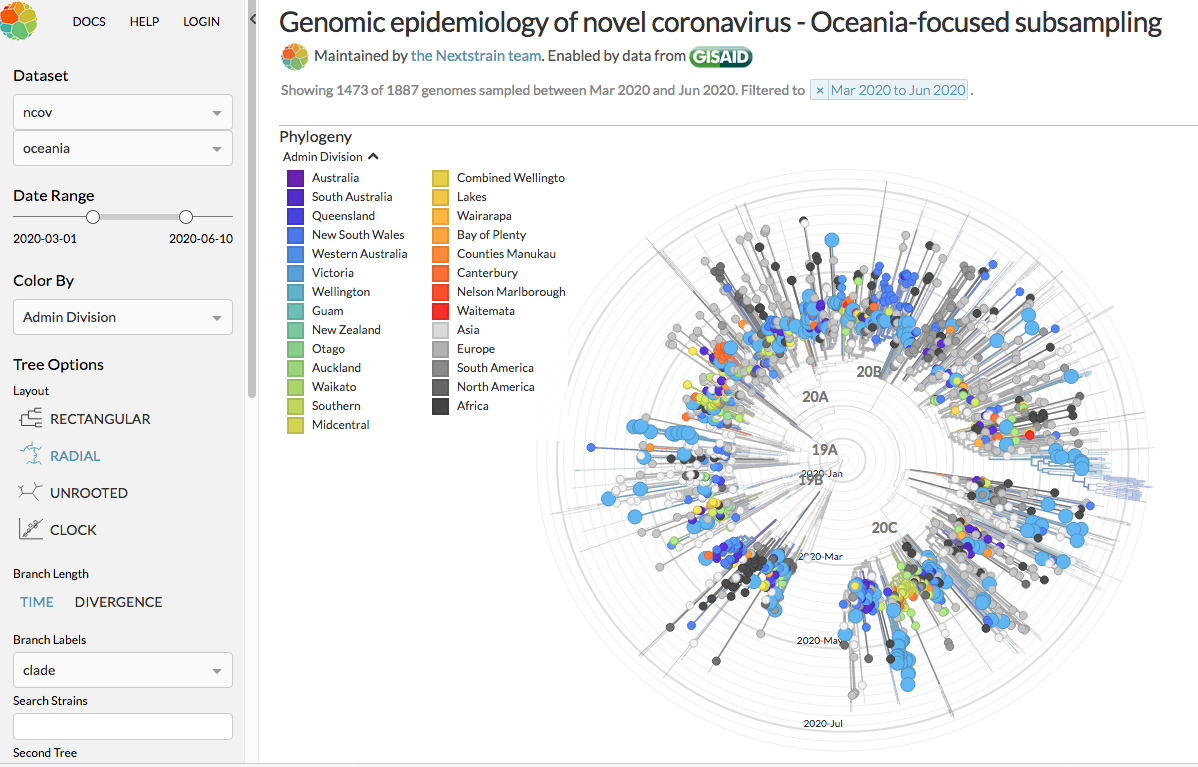
A plot of Covid19 varieties.
I found this web side fascinating. An open-source project that “aims to provide a real-time snapshot of evolving pathogen populations and to provide interactive data visualizations to virologists, epidemiologists, public health officials and citizen scientists”.
- The first image is post June 11; that was the day that we recorded no new cases. The major cluster is to the right, with a cluster of NSW cases (smaller darker dots) along side.
- Both states have other scatterd cases, possibly returning citizens in hotel quarantine.
- The second image is March 1 to June 10, that is the first wave. Note the much wider spread of genomics. They came from all over.
- More recently, Victoria seems to have stopped reporting around July 20, as is evident in the picture below, but more obvious at the site.


 The Glen Waverley Uniting Church PSALTER