|
Size: 2489
Comment:
|
Size: 2667
Comment:
|
| Deletions are marked like this. | Additions are marked like this. |
| Line 19: | Line 19: |
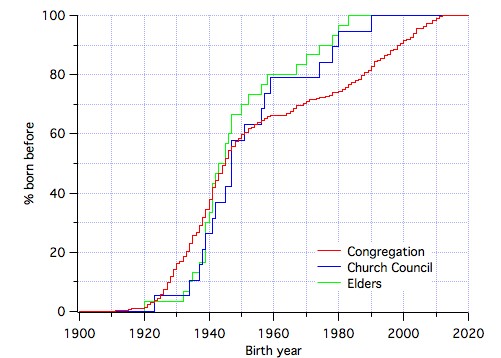
| ||<tablewidth="100%" style="border:none;text-align:left;"> This is the cumulative histograms for year of birth of the congregation, the Church Council and the Elder as at Feb 2013, for those whose birth year is recorded in the rolls database. <<BR>><<BR>>A cumulative histogram shows the % of the group who were born before the birth year on the bottom axis. In particular, the point where the lines cross 50% gives the median birth year of the group. In this case, 50% of the congregation, including children, were born before 1945, 50% of Council were born before 1947, and 50% of Elders were born before 1944. Both the youngest and oldest are under-represented on Council and Elders, but the median ages are very close, with Council being slightly "younger" than the congregation, and Elders marginally older. ||<style="border:none;text-align:left;">{{attachment:RelativeAgeProfiles.jpg}}|| | ||<tablewidth="100%" style="border:none;text-align:left;"> This is the cumulative histograms for year of birth of the congregation, the Church Council and the Elder as at Feb 2013, for those whose birth year is recorded in the rolls database. <<BR>><<BR>>A cumulative histogram shows the % of the group who were born before the birth year on the bottom axis. In particular, the point where the lines cross 50% gives the median birth year of the group. In this case, 50% of the congregation, including children, were born before 1945, 50% of Council were born before 1947, and 50% of Elders were born before 1944. Both the youngest and oldest are under-represented on Council and Elders, but the median ages are very close, with Council being slightly "younger" than the congregation, and Elders marginally older.<<BR>><<BR>>If those born since 1995, under 18s, are removed, the median year of birth for the congregation drops to 1942. If over 80s are also removed, the median becomes 1946. ||<style="border:none;text-align:left;">{{attachment:RelativeAgeProfiles.jpg}}|| |
A collection of statistical data about the congregation
Attendance history
Age profile
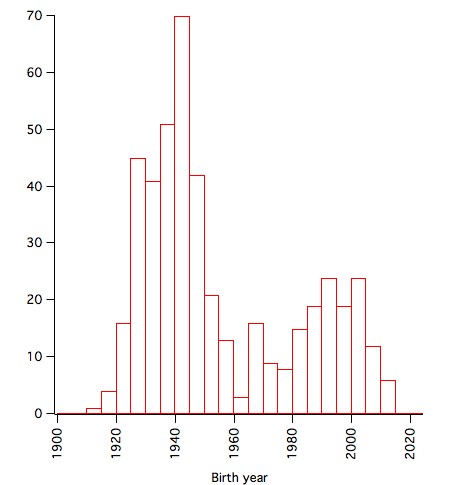
This is the histogram for year of birth from the church rolls database as at Feb 2013. Note that only about half of individuals in the database have year of birth recorded. |
|
Giving profile
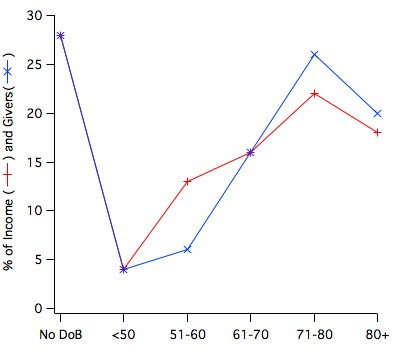
This is the histogram for the number of planned givers and the value of their giving, split by age of the givers. It only includes those with a fixed amount of planned giving, and so under reports total income. "NoDoB" indicates that no date of birth is recorded in the church rolls database for that giving unit. |
|
Relative age distributions of congregation, Council & Elders
This is the cumulative histograms for year of birth of the congregation, the Church Council and the Elder as at Feb 2013, for those whose birth year is recorded in the rolls database. |
|
Postcodes
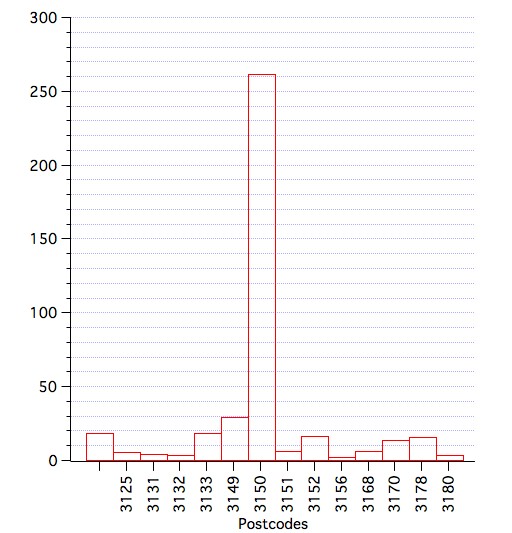
This is the histogram of postcodes for families in the church rolls database. Note the dominance of 3150. |
|
 The Glen Waverley Uniting Church PSALTER


