|
Size: 4096
Comment:
|
Size: 4020
Comment:
|
| Deletions are marked like this. | Additions are marked like this. |
| Line 24: | Line 24: |
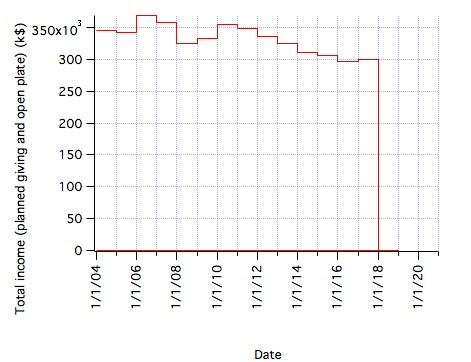
| ||<tablewidth="100%" style="border:none;text-align:left;"> This is the plot of the sum of planned giving and open plate for the last ten years. Other income, particularly rent and donations, is not shown. Donations to special projects are not included.<<BR>> We engaged Carolyn Kitto in 2009 to run the GrowingGenerousGivers program, which was followed by the 2010 increase. Thanks to Peter Stewart for extracting the data from our financial system.||<style="border:none;text-align:left;">{{attachment:GivingHistory.jpg}}|| | ||<tablewidth="100%" style="border:none;text-align:left;"> This is the plot of the sum of planned giving and open plate for the last ten years. Other income, particularly rent and donations, is not shown. Donations to special projects are not included.<<BR>> We engaged Carolyn Kitto in 2009 to run the GrowingGenerousGivers program, which was followed by the 2010 increase.||<style="border:none;text-align:left;">{{attachment:GivingHistory.jpg}}|| |
A collection of statistical data about the congregation
Attendance history
Age profile
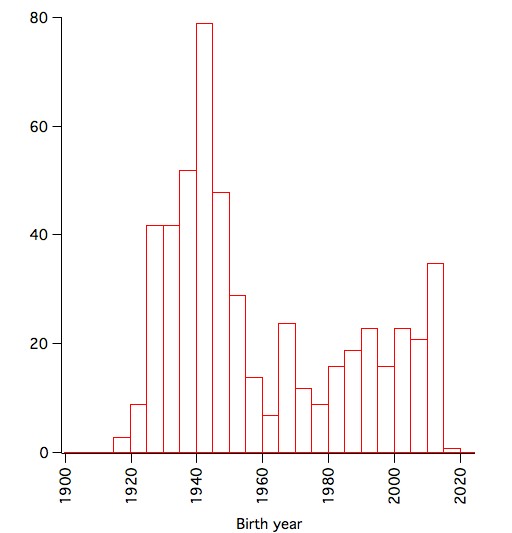
This is the histogram for year of birth from the church rolls database as at November 2016. Note that only about 60% of individuals in the database have year of birth recorded. |
|
Giving profile
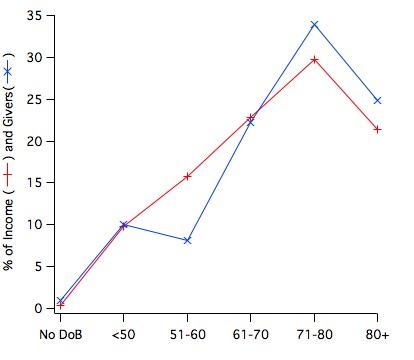
This is the histogram for the number of planned givers and the value of their giving, split by age of the givers, as at December 2013. It only includes those with a fixed amount of planned giving, and so under reports total income. "NoDoB" (<1%) indicates that no date of birth is recorded in the church rolls database for that giving unit, and we were unable to make a realistic estimate. About 25% of the birth dates are estimates. |
|
Relative age distributions of congregation, Council & Elders
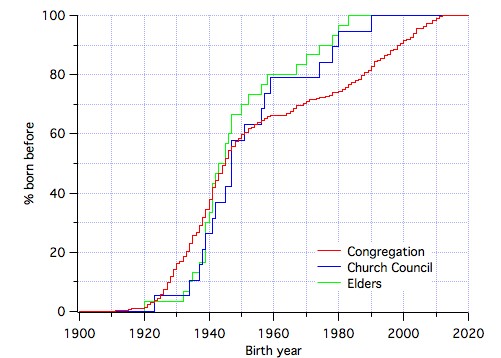
This is the cumulative histograms for year of birth of the congregation, the Church Council and the Elders as at Feb 2013, for those whose birth year is recorded in the rolls database. (19 of 23 Councillors, 30 of 35 elders) |
|
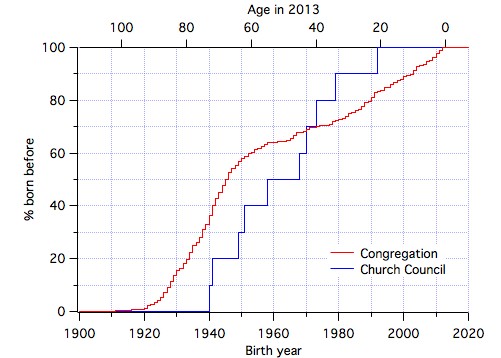
Corresponding graph for the New Church Council Sep 2013, with a few guesses. |
|
Giving history
This is the plot of the sum of planned giving and open plate for the last ten years. Other income, particularly rent and donations, is not shown. Donations to special projects are not included. |
|
Postcodes
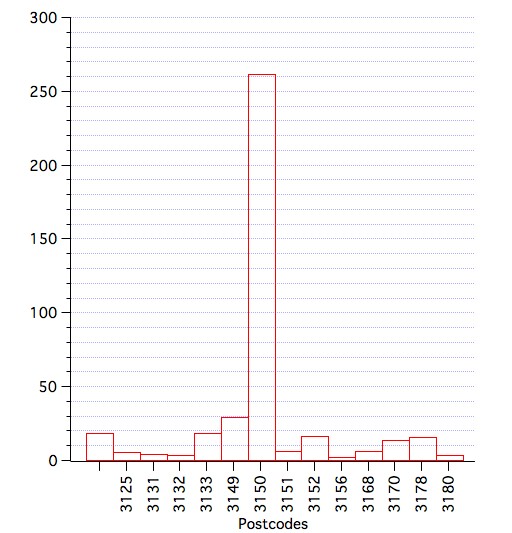
This is the histogram of postcodes for families in the church rolls database. Note the dominance of 3150. |
|
Giving Methods
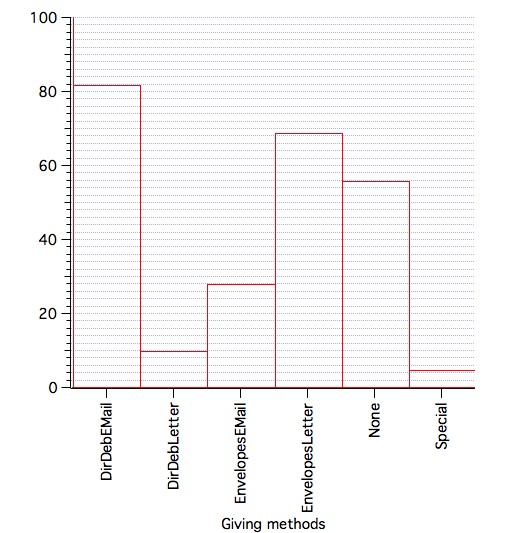
This is the histogram of the number of giving units (families or individuals) by method in July 2015. |
|
Census Data
Some census data for Glen Waverley has been transcribed at GlenWaverleyCensus.
 The Glen Waverley Uniting Church PSALTER