|
Size: 3165
Comment:
|
Size: 3241
Comment:
|
| Deletions are marked like this. | Additions are marked like this. |
| Line 15: | Line 15: |
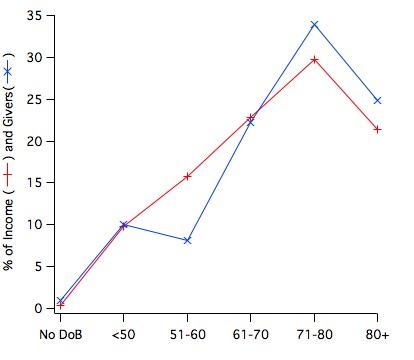
| ||<tablewidth="100%" style="border:none;text-align:left;"> This is the histogram for the number of planned givers and the value of their giving, split by age of the givers. It only includes those with a fixed amount of planned giving, and so under reports total income. "NoDoB" indicates that no date of birth is recorded in the church rolls database for that giving unit. About 25% of the birth dates are estimates. <<BR>><<BR>>Application of standard Australian actuarial data, assuming that the un-recorded dates of birth are distributed similarly to the recorded ones, leads to a most probably [[IncomeLossCalculation|prediction]] of 15% of income to be lost by death in the next five years and 30% in ten years.||<style="border:none;text-align:left;">{{attachment:GivingProfileDec2013.jpg}}|| | ||<tablewidth="100%" style="border:none;text-align:left;"> This is the histogram for the number of planned givers and the value of their giving, split by age of the givers, as at December 2013. It only includes those with a fixed amount of planned giving, and so under reports total income. "NoDoB" (<1%) indicates that no date of birth is recorded in the church rolls database for that giving unit, and we were unable to make a realistic estimate. About 25% of the birth dates are estimates. <<BR>><<BR>>Application of standard Australian actuarial data, assuming that the un-recorded dates of birth are distributed similarly to the recorded ones, leads to a most probably [[IncomeLossCalculation|prediction]] of 15% of income to be lost by death in the next five years and 30% in ten years.||<style="border:none;text-align:left;">{{attachment:GivingProfileDec2013.jpg}}|| |
A collection of statistical data about the congregation
Attendance history
Age profile
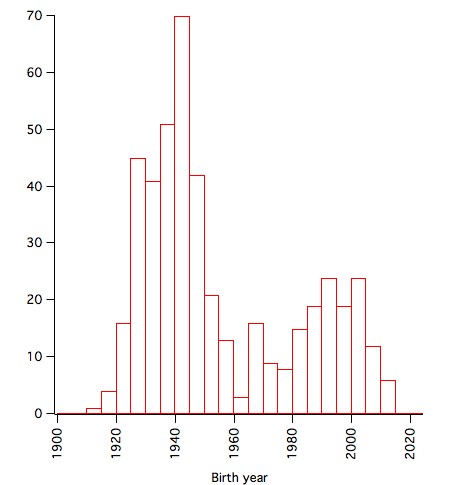
This is the histogram for year of birth from the church rolls database as at Feb 2013. Note that only about half of individuals in the database have year of birth recorded. |
|
Giving profile
This is the histogram for the number of planned givers and the value of their giving, split by age of the givers, as at December 2013. It only includes those with a fixed amount of planned giving, and so under reports total income. "NoDoB" (<1%) indicates that no date of birth is recorded in the church rolls database for that giving unit, and we were unable to make a realistic estimate. About 25% of the birth dates are estimates. |
|
Relative age distributions of congregation, Council & Elders
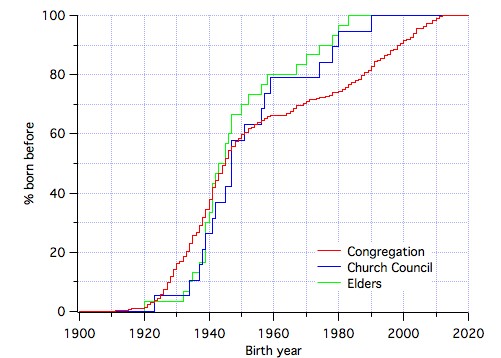
This is the cumulative histograms for year of birth of the congregation, the Church Council and the Elders as at Feb 2013, for those whose birth year is recorded in the rolls database. (19 of 23 Councillors, 30 of 35 elders) |
|
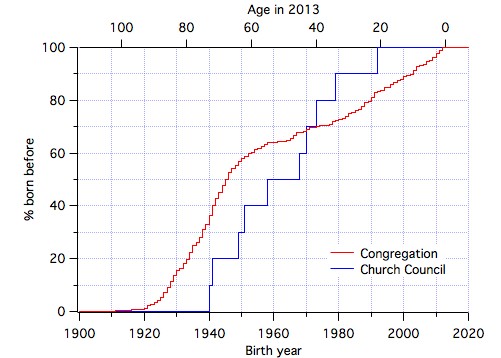
Corresponding graph for the New Church Council Sep 2013, with a few guesses. |
|
Postcodes
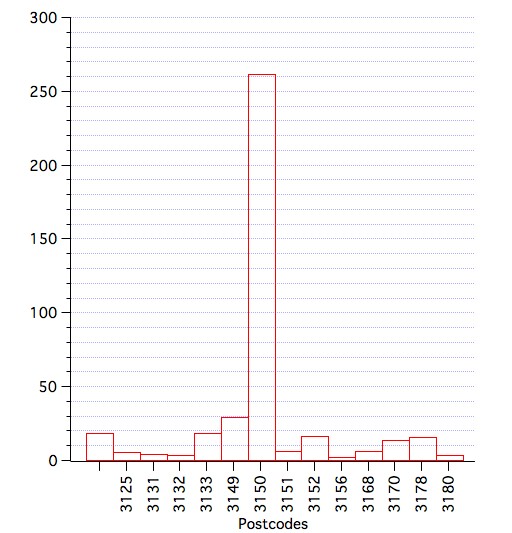
This is the histogram of postcodes for families in the church rolls database. Note the dominance of 3150. |
|
Census Data
Some census data for Glen Waverley has been transcribed at GlenWaverleyCensus.
 The Glen Waverley Uniting Church PSALTER